Next: DASH -- Distributed Analysis System Hierarchy
Up: User Interfaces, Visualization, Data Acquisition and Reduction
Previous: The ACSIS Data Reduction System
Table of Contents - Subject Index - Author Index - PS reprint -

Warren-Smith, R. F. & Berry, D. S. 2000, in ASP Conf. Ser., Vol. 216, Astronomical Data Analysis Software and Systems IX, eds. N. Manset, C. Veillet, D. Crabtree (San Francisco: ASP), 506

Recent Developments to the AST Astrometry Library

R. F. Warren-Smith
Starlink, Space Science and Technology Department, Rutherford Appleton Laboratory, Chilton, DIDCOT, Oxon, OX11 0QX, UK

D. S. Berry
Starlink, Department of Astronomy, University of Manchester, Oxford Road, MANCHESTER, M13 9PL, UK

Abstract:

The AST library supports the attachment of astrometric calibrations to astronomical datasets, the processing of this information, and generation of associated graphical output. The original implementation was described at the ADASS '97 meeting. In this paper we outline some more recent developments and applications, which include a set of efficient data re-gridding algorithms for curvilinear coordinate systems, improved FITS support, user-defined coordinate transformations, and pin-cushion/barrel distortion.

1. Introduction

The AST library provides facilities for processing information about coordinate systems in astronomy--attaching this information to datasets, propagating it through processing steps, aligning datasets, producing graphical output, etc. It can handle most of the sky coordinate systems commonly in use, plus any others you may care to invent.

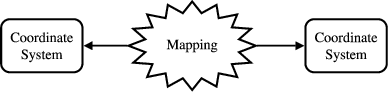
AST uses object-oriented concepts, but may be called from standard C and FORTRAN (it is implemented in ANSI C). The initial implementation was described at the ADASS '97 meeting (Warren-Smith & Berry 1998). This paper describes some more recent new features.

2. Image Re-Sampling

AST uses objects called Mappings to express how to transform between different coordinate systems (Figure 1).

Figure 1: In AST, a Mapping object encapsulates knowledge of how to convert between related coordinate systems.
\begin{figure}
\epsscale{0.60}
\plotone{P2-45a.eps}
\end{figure}

Often, having inter-related two datasets (e.g. images) in this way, you then need to re-sample (or re-bin) the data on to a common grid. For transformations which involve complex sky projections, it can prove expensive to compute these at every pixel, so AST now implements an adaptive sub-division algorithm that avoids unnecessary transformation evaluations.

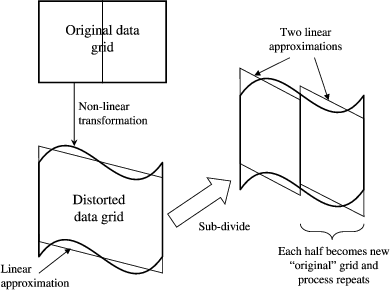
AST first approximates a non-linear transformation with a simple linear one. If this matches the true transformation sufficiently accurately, it is used, being fast to compute. Otherwise, the image is sub-divided along its largest dimension and a new linear approximation is found inside each half of the image. Sub-division continues until a sufficiently accurate piecewise linear approximation has been found. The algorithm adapts rapidly to non-linearity, so as to minimize the number of true transformation evaluations needed. This process is illustrated in Figure 2.

Figure 2: Adaptive sub-division of a dataset replaces a non-linear coordinate transformation by a piecewise linear approximation, allowing more efficient data re-gridding.
\begin{figure}
\epsscale{0.6}
\plotone{P2-45b.eps}
\end{figure}

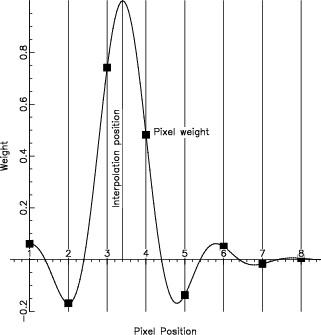
Sub-pixel interpolation between data values may also be required if the transformed pixel positions are not at integer-valued locations. AST supports a variety of interpolation methods based on weighted sums of nearby pixels. You can also provide your own interpolation function. AST's built-in weighting kernels include the popular linear-interpolation and nearest-neighbor schemes, as well as sinc, sinc xsinc, sinc xcos and sinc xgaussian variants (e.g. Figure 3), which are suitable for well-sampled data. Missing data can also be accommodated.

Figure 3: Sub-pixel interpolation with a sincxgaussian weighting kernel, one of the built-in kernels provided by AST.
\begin{figure}
\epsscale{0.5}
\plotone{P2-45c.eps}
\end{figure}

All of these re-sampling algorithms are available in 1, 2, 3 or more dimensions via a single function call.

3. Improved FITS Support

Many types of AST data may readily be converted to/from FITS headers for storage. Pending a final FITS World Coordinate System standard, an interim convention has been adopted, based on a stable set of keywords used by IRAF. Meanwhile, a parallel strand of development is tracking the official FITS standardization efforts. Other historical variants also remain supported.

In practice, therefore, AST is now able to read/write most available FITS headers which describe coordinate systems.

4. User-Defined Transformations

In FITS, relationships between coordinate systems (like sky projections) fall into pre-defined and fairly rigid categories. This can prove awkward if you suddenly need a new type of coordinate system which has not been anticipated. To address this, AST now includes two methods for describing ``user-defined'' transformations. These allow considerable flexibility in describing new coordinate systems which apply to real-world problems.

The first approach allows a function written in C or FORTRAN to be packaged as an AST object (a form of Mapping). It may then participate in any AST operation, such as image re-sampling or generation of graphical output. This allows a programmer great freedom in defining new coordinate transformations. However, since it requires linking with locally-compiled code, it cannot describe coordinate systems in a transportable manner.

To overcome this, the latest version of AST (V1.4) contains an expression parser which can interpret transformations expressed in mathematical notation at run-time. A range of operators and mathematical functions are provided, so that C code such as the following can be used to define new transformations (note how the transformation is actually 2-dimensional, but a number of intermediate results are first computed):


char *forward[] = {  "rin = sqrt( XIN * XIN + YIN * YIN )",
                     "rout = rin * ( 1 + 0.1 * rin * rin )",
                     "theta = atan2( YIN, XIN )",
                     "XOUT = rout * cos( theta )",
                     "YOUT = rout * sin( theta )"  };

char *inverse[] = {  "rout = sqrt( XOUT * XOUT + YOUT * YOUT )",
                     "r = rout / 0.2",
                     "d = sqrt( 1 / 27e-2 + r * r )",
                     "rin = pow( d + r, 1/3 ) - pow( d - r, 1/3 )",
                     "theta = atan2( YOUT, XOUT )",
                     "XIN = rin * cos( theta )",
                     "YIN = rin * sin( theta )"  };

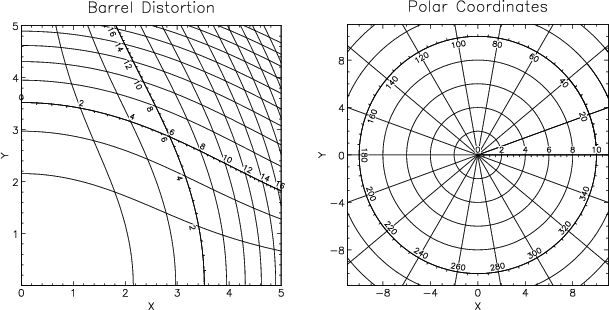
A constructor function is then called to compile these arrays into a new AST object (a MathMap) which, in this case, describes barrel distortion. Shown in Figure 4 (left) is an example of a coordinate grid drawn automatically by AST for this transformation. Note that AST has no built-in knowledge about this coordinate system, beyond the equations above. These might, for example, have been obtained from FITS headers. A similar example using polar coordinates is also shown (Figure 4, right).

Figure 4: Barrel distortion and polar coordinate grids plotted automatically from expressions compiled at run-time.
\begin{figure}
\epsscale{0.50}
\plottwo{P2-45d.eps}{P2-45e.eps}
\end{figure}

References

Warren-Smith, R. F & Berry, D. S. 1998, in ASP Conf. Ser., Vol. 145, Astronomical Data Analysis Software and Systems VII, ed. R. Albrecht, R. N. Hook, & H. A. Bushouse (San Francisco: ASP), 41


© Copyright 2000 Astronomical Society of the Pacific, 390 Ashton Avenue, San Francisco, California 94112, USA
Next: DASH -- Distributed Analysis System Hierarchy
Up: User Interfaces, Visualization, Data Acquisition and Reduction
Previous: The ACSIS Data Reduction System
Table of Contents - Subject Index - Author Index - PS reprint -

adass@cfht.hawaii.edu