 |
Traditional single dish mapping techniques involve pointing the telescope at regular grid points covering the region of interest and integrating at each point until the desired signal to noise ratio is achieved. The initial single dish imaging tool in AIPS++ provides a few tools to examine and image these types of observations.
Three functions are available in the SDImager tool in the first release of AIPS++.
Future work with these tools will be focussed on improving the interface to make them more automatic (requiring fewer parameters). Two additional functions are planned.
In order to increase the yield of single dish telescopes, OTF observing techniques have been implemented. These techniques optimize mapping efficiency and improve calibration over the mapped field by rapidly scanning across the region of interest. The resulting data, which has not been observed at regular grid points, must then be gridded to produce an image.
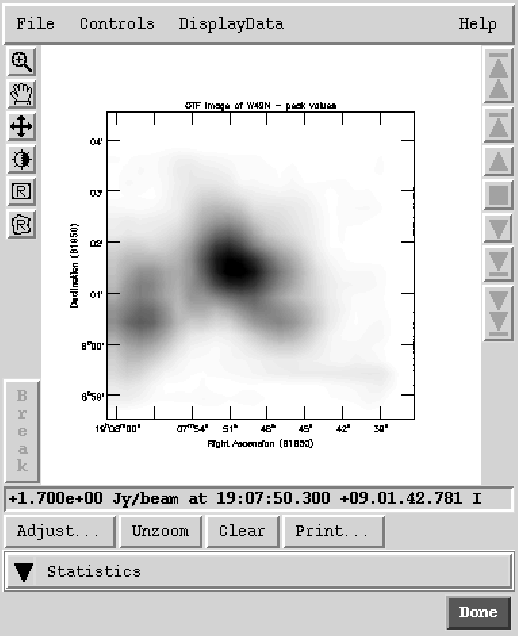
The results shown in Figure 2 are from recent work in AIPS++; these tools are not yet available in an AIPS++ release. The data used are from an OTF observing run at the NRAO 12m telescope taken towards the same source used in the previous section of this paper. The initial calibration, done before the image was constructed, used off-source integrations taken at the end of each OTF pass across the region.
The image was constructed using the same framework as is used for synthesis imaging in AIPS++. The only required change was the addition of a C++ class responsible for the actual gridding of the single dish measurements. The design of the AIPS++ calibration and imaging system is described in Cornwell & Wieringa (1997).
Removal of artifacts due to gain drifts was accomplished by fitting and subtracting baselines. This was done using a simple Glish script that called on the functions of the AIPS++ image tool and the AIPS++ polynomial fitter. Figure 2 shows an image of the peak values from the final gridded image. It is displayed using the AIPS++ viewer.
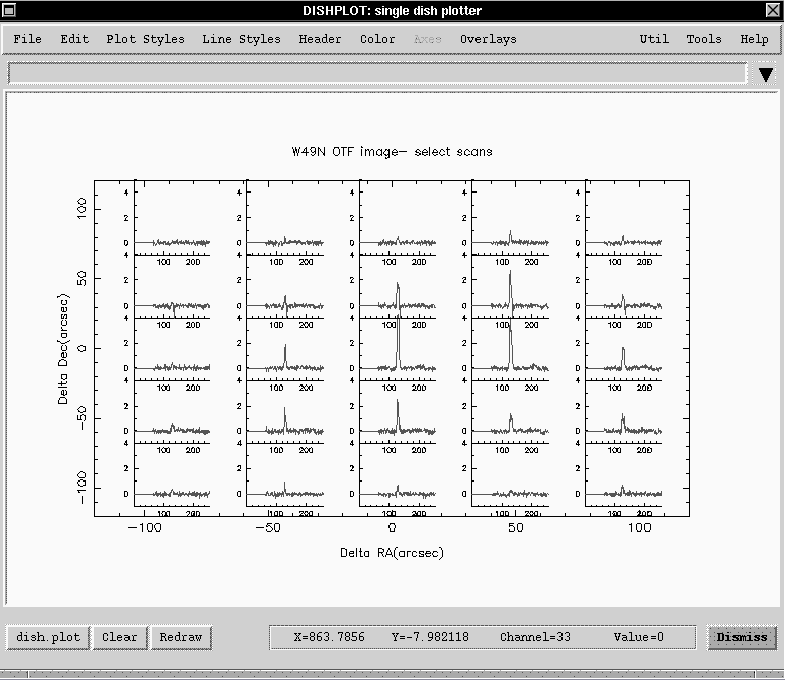
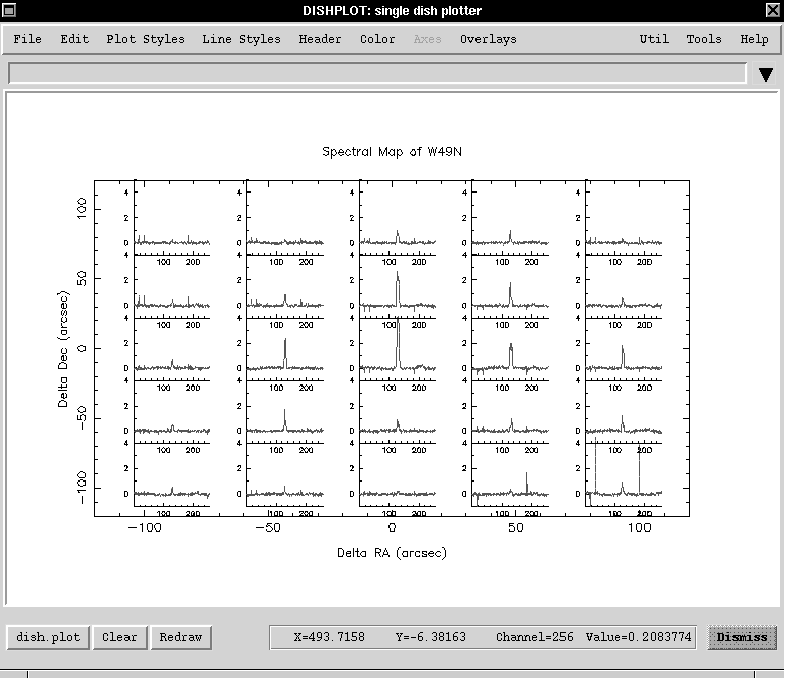
DISH and the SDImager tools described in the previous section of this paper can be used to examine the individual spectra in the gridded image. A plot using the spectramap function and select spectra from the OTF image is shown in Figure 3.
Our next goal is to implement the calibration steps using the AIPS++ calibration classes and to combine OTF data with synthesis observations.
Cornwell, T. J., & Wieringa, M. H. 1997, in ASP Conf. Ser., Vol. 125, Astronomical Data Analysis Software and Systems VI, ed. G. Hunt & H. E. Payne (San Francisco: ASP), 10
Garwood, R. W., & McMullin, J. P. 2000, this volume, 498