Next: Synthetic Images of the Solar Corona from Octree Representation of 3-D Electron Distributions
Previous: On Fractal Modeling in Astrophysics: The Effect of Lacunarity on the Convergence of Algorithms for Scaling Exponents.
Up: Modeling
Table of Contents - Index - PS reprint - PDF reprint
Astronomical Data Analysis Software and Systems VI
ASP Conference Series, Vol. 125, 1997
Editors: Gareth Hunt and H. E. Payne
R. Smareglia and P. A. Mazzali
Astronomical Observatory of Trieste,
Via Tiepolo,11,
34131 Trieste, Italy
Abstract:
The nebular spectra of SNeIa can be used to determine the mass, density,
and distribution of the SN ejecta,
and the distance and reddening
to the SN. Synthetic spectra can very rapidly be computed in NLTE and
compared to the observed ones. Given the relatively large number of
parameters, it is convenient to explore the parameter space in an
automated form. The nebular spectrum synthesis code can be run in
parallel on a workstation cluster. Each synthetic spectrum is immediately
compared to the observed one.
Exploration of the parameter space can be guided by the information
available on some quantities (e.g., line width). The results for a few cases
of ``normal'' and possibly peculiar SNeIa are presented and discussed.
In the nebular phase, the (emission) spectrum of a SN Ia is formed in the
densest, innermost part of the ejecta, and is dominated by forbidden lines of
FeII and FeIII. Modeling this phase thus offers a unique opportunity to
investigate the properties of the central region of the ejecta, where
explosive nuclear burning is thought to be most efficient. Moreover, since
nebular emission depends directly on the density, a successful model of this
emission should yield values of the masses of the elements visible in the
spectrum and, through the cooling effect of other elements, also of the total
mass in the nebula. The parameter necessary to convert
from density to mass is the
velocity (the epoch is known), which can be inferred from the FWHM of the
emission lines under
the assumption of optically thin gas. Our model is based
on a NLTE treatment of the rate equations
for a nebula of uniform density. This simplifying assumption is reasonably well
justified since all explosion models predict that the density near the centre
of the ejecta is a much weaker function of radius than in the outer layers. The
necessary input is then limited to the mass and composition of the ejecta, the
sphere's outer velocity, and the time since explosion. Heating of the nebula
comes from the deposition of energy generated in the radioactive
 -decay of 56Co into 56Fe. This energy is produced in the form
of
-decay of 56Co into 56Fe. This energy is produced in the form
of  -rays and positrons, which lose their energy in the ionization of
the gas and in heating the plasma through collisions with electrons, in a
cascade process. Eventually, a fraction of the produced energy is thermalized,
and the heated gas cools by net emission of radiation. The electron density and
temperature, as well as the population of the atomic levels and the emission
line fluxes, are determined simultaneously from the conditions of statistical
and thermal equilibrium.
-rays and positrons, which lose their energy in the ionization of
the gas and in heating the plasma through collisions with electrons, in a
cascade process. Eventually, a fraction of the produced energy is thermalized,
and the heated gas cools by net emission of radiation. The electron density and
temperature, as well as the population of the atomic levels and the emission
line fluxes, are determined simultaneously from the conditions of statistical
and thermal equilibrium.
The synthetic spectra are then corrected for the distance and
reddening to the observed SN, and compared to the observed spectrum.
The basic treatment of nebular emission in a SN Ia was given by Axelrod (1980).
A similar version of the code used here was employed by Ruiz-Lapuente & Lucy
(1992), to which the reader is referred for further details. Our atomic data
for the nebular spectrum model are from the sources quoted in Ruiz-Lapuente
& Lucy (1992), with the exception of the [FeII] collision strengths, which
were obtained from Pradhan & Zhang (1993).
A further refinement included in this work is the introduction of the
possibility that the gas is not distributed uniformly within the sphere. This
is expressed in the form of a filling factor, which represents the fraction of
the volume occupied by the gas. The effect of using a filling factor smaller
than unity is to increase the local gas density, and thus to change the
ionization regime.
In practice, the epoch and the velocity give the size of the sphere, while the
mass and the filling factor give the density. The Ni mass gives the energy
input. Since the epoch is known, and since we adopt a constant composition,
apart from the decay of 56Ni into Co and Fe, there are three parameters
that can be changed in the building of
the physical model: velocity, mass, and filling factor. The remaining two
parameters, distance and reddening, can be changed when comparing a synthetic
model to an observed one.
In this paper, we report on the modeling of a normal SN Ia: SN1992A.
There are five unknown parameters: velocity V, mass M, filling factor
 distance µ, and reddening
  . We need to determine three
of these to establish the
SN proprietes. The grid can be set with a knowledge of the most likely range of
properties for a normal SN Ia, while the distance and reddening grids are
determined on the basis of observational estimates for the object under study,
as show in Table 1.
. We need to determine three
of these to establish the
SN proprietes. The grid can be set with a knowledge of the most likely range of
properties for a normal SN Ia, while the distance and reddening grids are
determined on the basis of observational estimates for the object under study,
as show in Table 1.

Table: Range of values
We have a total 235,950 possible models. A single model on an high
performance (57MFLOPS) workstation such as an HP 735/125, takes 6seconds,
plus the time for the comparison with the observed spectrum.
The simulation program can be split into two parts:
- Physical model: the spectrum at the source is created using the
parameters (M,
 ,
,  ). This requires about 5cpu seconds.
- Synthetic spectrum: the physical model is corrected
for the observational parameters (µ,
 ).
This requires about 1cpu second.
).
This requires about 1cpu second.
Finally, a  determination
is used to check the goodness of the fit.
determination
is used to check the goodness of the fit.
We used a very simple ``master/slave" parallel architecture based on the
LAM/MPI software:
- Master:
- it first checks the available guest hosts,
then it organizes the sharing of the tasks among the slaves. Every single task
has a defined value for the parameter triplet (M,
 ,
,  ). When the
entire parameter space has been scanned, the Master organizes all results into a
single ASCII file containing the model parameters and the fitting test results.
). When the
entire parameter space has been scanned, the Master organizes all results into a
single ASCII file containing the model parameters and the fitting test results.
- Slave:
- it acquires the values of (M,
 ,
,  ), and creates
the ``physical spectra.'' It then uses an
IDL procedure to convert from the ``physical
spectra'' to the ``synthetic spectrum,''
for values of µ and
), and creates
the ``physical spectra.'' It then uses an
IDL procedure to convert from the ``physical
spectra'' to the ``synthetic spectrum,''
for values of µ and  ,
which is compared to the observed spectrum. The results of the fit,
which can be applied to the entire spectrum or to a particular region, are
passed back to the Master.
,
which is compared to the observed spectrum. The results of the fit,
which can be applied to the entire spectrum or to a particular region, are
passed back to the Master.
Trieste Astronomical Observatory has a heterogeneous workstation
environment, with 6 Sun and 14 HP computers available. For this work we
used 9 homogeneous HP computers with a total power of 273MFLOPS. The full
computional work (i.e., simulation plus best fit test) was run at night
at low priority and required about 16hours, against the 493hours which
would have been required to run it sequentially.
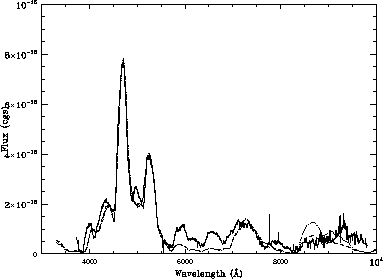
Figure: The spectrum of SN 1992A (continous line) compared to the best fitting
models for  (dotted line) and
  (dash-dotted line).
The corresponding values of mass
and distance can be read from Figure 2.
Original PostScript figure (96kB).
(dash-dotted line).
The corresponding values of mass
and distance can be read from Figure 2.
Original PostScript figure (96kB).
In the case of SN 1992A, the velocity was first determined as
v=8500km/s from fitting the line width. Since the (small) reddening is
known, ( ), good fits can be obtained for different
values of the mass and the distance, if different values of the filling
factor are used.
), good fits can be obtained for different
values of the mass and the distance, if different values of the filling
factor are used.
The interesting result is that the best fits for the various values of  are practically indistinguishable, as shown in Figure 1. Some
physical insight must therefore be applied.
If we assume that we know from explosion models the mass ejected with velocities
below the observed value, then an estimate of the
most likely values of distance and filling factor can be derived (Figure 2).
are practically indistinguishable, as shown in Figure 1. Some
physical insight must therefore be applied.
If we assume that we know from explosion models the mass ejected with velocities
below the observed value, then an estimate of the
most likely values of distance and filling factor can be derived (Figure 2).
In the standard SNIa explosion model (W7, Nomoto et al. 1984),
1.4M of material is ejected, 0.7M
 of which
has velocities below 8,500km/s. The best fitting model for this
value of enclosed mass has µ ~31.5mag and
of which
has velocities below 8,500km/s. The best fitting model for this
value of enclosed mass has µ ~31.5mag and  ~0.55.
Using the tools available at the Observatory (IDL and a distributed password
system), and a public domain software package (LAM/MPI
Parallel Computing), it is possible to create, optimize, and automate the
comparison of synthetic spectra with observed Supernova spectra. The
scientific user must then decide (as pointed out above) the correct physical
properties if best fits having similar appearance, but different physical
characteristics, are present.
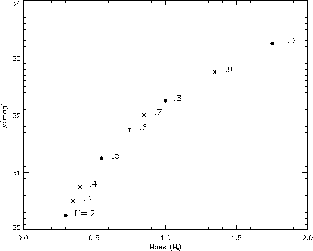
Figure: Best fit for various filling factors.
Original PostScript figure (83kB).
Acknowledgments:
The technology group of the OAT is gratefully acknowledged for the support
given during this work. The project for parallel
implementation of scientific codes has been financed by a CRA grant.
References:
Gregory, D. B., Raja, B. D., & James, R. V. 1994,
LAM: An Open Cluster Environment for MPI, Supercomputing Symposium '94,
Toronto
Nomoto, K., Thielemann, F. K., & Yokoi, K. 1984, ApJ, 286, 644
Ruiz-Lapuente, P., & Lucy, L. B. 1992, ApJ, 400, 127
© Copyright 1997
Astronomical Society of the Pacific,
390 Ashton Avenue, San Francisco, California 94112, USA
Next: Synthetic Images of the Solar Corona from Octree Representation of 3-D Electron Distributions
Previous: On Fractal Modeling in Astrophysics: The Effect of Lacunarity on the Convergence of Algorithms for Scaling Exponents.
Up: Modeling
Table of Contents - Index - PS reprint - PDF reprint
payne@stsci.edu