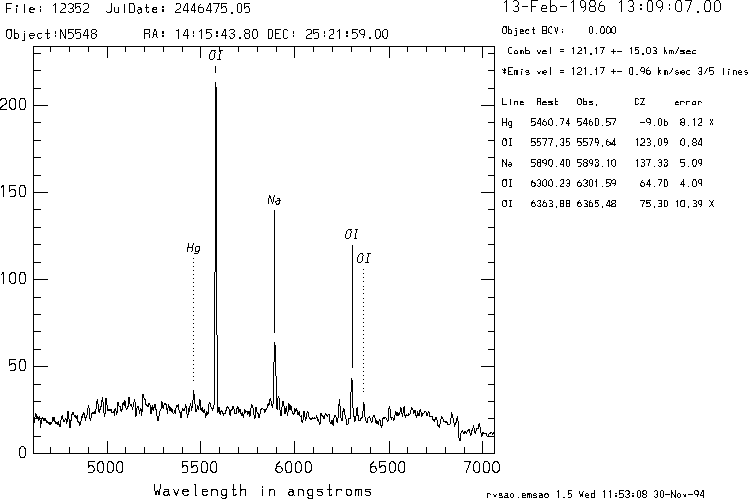
Figure: This EMSAO Summary page shows line centers and fit information for a night sky spectrum. Original PostScript figure (58 kB)
D. J. Mink, W. F. Wyatt
Harvard-Smithsonian Center for Astrophysics, 60 Garden St., Cambridge, MA 02138
When SAO moved its redshift program from minicomputers to workstations, it was decided that NOAO IRAF, a standard reduction system, be used, rather than the previous custom Forth system (Tonry & Wyatt 1988). At the time, no specialized radial velocity software existed inside IRAF, so the RVSAO package was developed. While the redshifts of many spectra can be computed by cross-correlating them against templates, that process is more complicated for spectra exhibiting strong emission lines. For large surveys, the interactive determination of line centers and calculation of redshifts by a program such as IRAF's SPLOT, is simply too slow. EMSAO, a companion to the cross-correlation task XCSAO (Kurtz et al. 1992), was written to find emission lines automatically, compute redshifts for each identified line, and combine them into a single radial velocity. The results may be graphically displayed or printed. The graphic cursor may be used to change fit and display parameters.

Figure: This EMSAO Summary page shows line centers and fit information
for a night sky spectrum.
Original PostScript figure (58 kB)
EMSAO takes a list of 1-dimensional wavelength-calibrated spectra in either IRAF one-dimensional or MULTISPEC format. Dispersion information is read from the world coordinate system keywords in the image headers. After reading the spectrum, an initial velocity guess is used to search for lines from an input line list. That velocity guess may come from an input parameter, a velocity in the image header, or an identification of one line in the spectrum. This last method uses a table of lines and the wavelength range over which each one should be the strongest line. This table can be modified by the user to match a given dataset. The search for the rest of the emission lines is carried out in a similar way, driven by a different table with smaller wavelength tolerances. After the lines are identified, Gaussian profiles are fit to more exactly determine the line centers. A third table identifies combined lines, such as the N1--H--N2 triplet at 6548Å, 6563Å, and 6584Å, and multiple Gaussians are fit simultaneously.
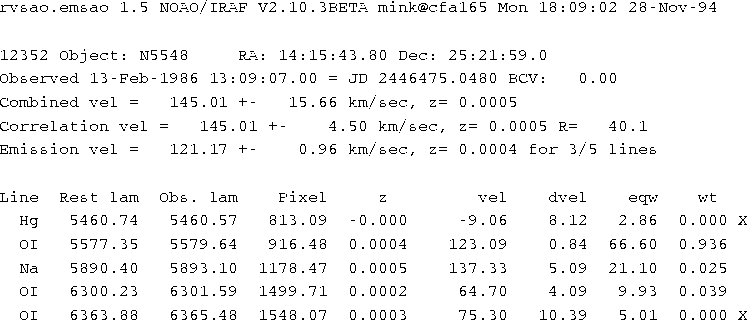
After redshift velocities are determined for each of the lines, an error-weighted mean is computed, omitting the velocities from those lines whose fits do not meet certain criteria. If good cross-correlation and emission line velocities exist for a given object, a combined velocity is also computed. The results may be graphically displayed with emission and/or absorption lines (from a fourth table) labeled as in Figure 1, logged in any of several formats to a file or text terminal, and/or written into the spectrum's header. Figure 2 shows the most verbose tabulation of EMSAO results, with wavelength center and velocity information for each line. If the results are displayed graphically, individual identified lines may be added to or subtracted from the emission line velocity, the spectrum may be edited, and several other conditions of the fit may be changed.

Figure: This is a tabulation, with report_mode=1, of the EMSAO
results displayed graphically in Figure 1.
Original PostScript figure (42 kB)
To test EMSAO adequately, a lot of emission line spectra were needed. The Smithsonian Astrophysical Observatory has archived 27,000 galaxy and stellar spectra from its Z-Machine spectrograph. Since a sky spectrum is filed with each object spectrum, there exist 27,000 easily-available spectra of night sky emission lines. As these mercury, oxygen, and sodium lines are airglow lines from the upper atmosphere or emission from artificial sources such as street lights, they should exhibit a negligible Doppler line shift.
An IRAF program was already being used to convert Z-Machine spectra from SAO's internal archive format to IRAF .imh and .pix files (Mink & Wyatt 1992). A substitute line list was set up with all of the bright night sky lines. Since the mercury and sodium line strengths varied significantly, they were dropped in favor of the more stable oxygen lines. The 6300Å [O I] line can show significant variations in intensity within a single night, but that is a story for another paper. The screen output of EMSAO for an individual night sky spectrum is shown in Figure 1. An IRAF CL script was written to run through the entire archive, or portions thereof, with a single command.
The results were tabulated in a file shown in Figure 3, where the
columns are reduced file number, Julian Date of observation, emission
line velocity and error, cross-correlation velocity (from a galaxy template)
with error and R-value, combination velocity and error, quality flag,
number of lines found, number of lines fit, and velocities in kms for [O I] lines at 5577.35Å, 6300.23Å, and 6363.88Å.

Figure: A portion of the tabulated results for 27,171 night sky spectra
produced by EMSAO with report_mode=3.
Original PostScript figure (25 kB)
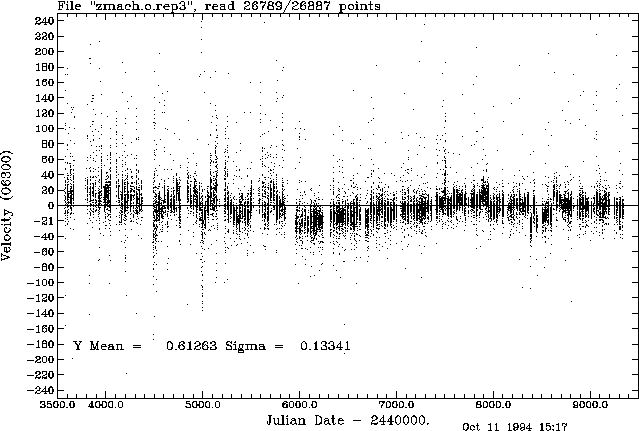
Due to the distribution of lines in the calibration lamp spectrum, the
position of the [O I] line at 6300Å was most certain. Figure 4
shows the velocity shift computed from the change in the position of the
center of that emission line over the 15-year lifetime of the Z-Machine
spectrograph on the 1.5 m Tillinghast Reflector. Each vertical grouping is
one month's dark-time run, with larger gaps usually indicating summer telescope
shutdown. It is obvious that some runs had a large scatter in sky
``velocities,'' but for the most part, the sky ``velocity'' distribution is
within the 63 km s that a one-pixel shift in the emission line would
cause.

Figure: Velocity shift in 6300Å OI night sky line over 15 years
as observed from Mt. Hopkins, Arizona.
Original PostScript figure (687 kB)
RVSAO can be obtained via anonymous FTP from cfa-ftp.harvard.edu in the pub/iraf directory. On-line documentation with examples is available on the World Wide Web at the RVSAO home page.
Mink, D. J., & Wyatt, W. F. 1992, in Astronomical Data Analysis Software and Systems I, ASP Conf. Ser., Vol. 25, eds. D.M. Worrall, C. Biemesderfer, & J. Barnes (San Francisco, ASP), p. 439
Tonry, J. L., & Wyatt, W. F. 1988, CFA Z-Machine Data Analysis Software (Cambridge, Smithsonian Astrophysical Observatory)