Next: A Parallel Procedure for the Analysis
of Long-term Sequences of Light Curves
Up: Applications
Previous: Determination of the Permissible Solutions Area by Image Reconstruction from a few Projections: Method 2-CLEAN DSA
Table of Contents -- Index -- PS reprint -- PDF reprint
A. V. Boulatov and L. K. Kashapova
Institute of Solar-Terrestrial Physics, Siberian Division of
Russian Academy of Sciences, P.O.Box 4026, Irkutsk, 664033, RUSSIA
This paper presents methods for converting photographic images, collected at the Large Solar Vacuum Telescope (Baikal Astrophysical Observatory) to digital images, similar to CCD pictures. Special algorithms were used for this task and have been implemented in the IDL environment. The results of processing real spectral data and a comparison of processed photographic images and images taken with a TEK CCD are presented.
The Large Solar Vacuum Telescope (LSVT) is one of the exceptional astronomical instruments belonging to the Institute of Solar-Terrestrial Physics, the Siberian Division of the Russian Academy of Sciences (Skomorovsky & Firstova 1996). Because of the excellent spatial (0.3'') and spectral (0.2-0.5Å/mm) resolution of the instrument and also local seeing conditions (the telescope is situated on the shore of Lake Baikal) we have the ability to investigate fine structure of the Sun. These observations are used to investigate short-time phenomena, e.g., solar flares, and also for the study of long-period features, e.g., the solar cycle. For this work series of observations are usually taken.
During the long period of solar maximum we used a photographic camera with 35-mm film for imaging with our telescope. A considerable amount of valuable data (photographic images on films and plates) was taken and then collected for future processing and analysis. During recent years, instead of the photographic camera we have begun to make observations with modern devices such as CCD systems. These have many advantages in comparison with photographic methods: linearity, higher sensitivity, and so on.
To analyze long-period solar features we have to use both old and new observations, i.e., photographic images and frames from the CCD detector. Both photography and CCD techniques have their own characteristics which influence the image. In order to perform reliable analysis we need to convert the different detector data to a homogeneous type.
We have created a set of programs for such corrections based on the IDL language. One of the research fields of our group is the mechanism of energy transport and energy release in solar flares. It is studied using polarization observations. We present the work of these IDL programs using the example of our spectral polarization observations and data analysis.
All observations were obtained at the LSVT as described above. On the one
hand the exposure time is determined by the instability of the earth's
atmosphere and on the other it is determined by detector
sensitivity. So exposure times for the photographic observations were
0.45 sec and the CCD detector allows exposures of about 0.1 sec. We used
a Wollaston prism and two ![]() -plates to separate the ordinary and
extraordinary rays.
-plates to separate the ordinary and
extraordinary rays.
The first CCD system, which we mounted inside the telescope spectrograph, was a CCD system from a St. Petersburg firm with exchangeable CCD heads. There were heads with 800x400 and 370x290 pixels arrays. Using this system we can take frames with very short exposures even with a dispersion of 0.0051 Å/pixel. This CCD system is controlled by microprogramming code and external Pascal programs.
In addition to that system we also use one amateur class CCD system (SBIG ST-6 with the supplied control program) at our telescope and, during the last few months, also another professional CCD system (Spectroscopic Instruments TEK CCD 512x512 with ST-130 controller and WinView). The basic differences between these systems are their array sizes and the rate of obtaining sequential frames (the minimum interval between successive frames). The main calibration procedures (removing the dark current, accounting for the flatfield frames and so on) are similar for all CCD systems (McLean 1989).
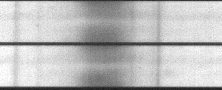
As mentioned above, photographic images were taken on the 35-mm film. In
Figure 1 a typical view of our polarization data is
presented. The two spectral bands correspond to orthogonally
polarized spectral bands. You can see the so-called ``moustaches" (Ellerman
bombs).
 |
Digitizing of the photographic images was performed in 3 alternative ways:
After such procedures we can write a digitized frame of the picture taken from the film. To obtain intensity values from the photographic image we have to use the characteristic curve for the film and at the same time we should take account of the transfer function of the CCD (used as the digitizer) and the uniformity of light in the microphotometer. This is very important for future accurate analysis of real solar data. Also at this stage we carry out procedures which are specific to every frame, removing errors (e.g., dust or cuts on film), trends and disturbances from the photographic image. After that we can use the digitized image from photographic plate or film as input for astrophysical investigation.
After the calibration the real processing begins, in our example, with
mapping of the ![]() contour and obtaining the spectral profile.
We take sections across or along the dispersion direction over the
region being investigated to make effective use of computer memory.
We also normally load a colour look-up-table to make the processing
of the selected profiles more convenient and clear.
contour and obtaining the spectral profile.
We take sections across or along the dispersion direction over the
region being investigated to make effective use of computer memory.
We also normally load a colour look-up-table to make the processing
of the selected profiles more convenient and clear.
Using spectral atlas data we then define some basic lines
close to ![]() and, with the help of the computer mouse, mark
the position of these lines on the frame and obtain the calculated position
of the
and, with the help of the computer mouse, mark
the position of these lines on the frame and obtain the calculated position
of the ![]() line centre on the frame and the average dispersion for
a set of frames.
Once this is done we can operate using wavelength instead of pixels on the
frame. For the following polarization calculation two spectral bands
are shifted to each other in order to combine the
line centre on the frame and the average dispersion for
a set of frames.
Once this is done we can operate using wavelength instead of pixels on the
frame. For the following polarization calculation two spectral bands
are shifted to each other in order to combine the ![]() centre from
different bands.
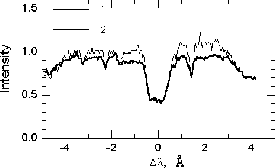
Results of such processing, showing the corrected spectral profiles of the
moustache, are shown in Figure 2. The thin line corresponds to the
ordinary ray and
the thick line relates to the extraordinary one. The next step is to
obtain polarization vectors and additional checks for artificial influences
on the spectral image (e.g., high-order trends, instrumental effects). Then
we prepare the best visualization of the results.
centre from
different bands.
Results of such processing, showing the corrected spectral profiles of the
moustache, are shown in Figure 2. The thin line corresponds to the
ordinary ray and
the thick line relates to the extraordinary one. The next step is to
obtain polarization vectors and additional checks for artificial influences
on the spectral image (e.g., high-order trends, instrumental effects). Then
we prepare the best visualization of the results.
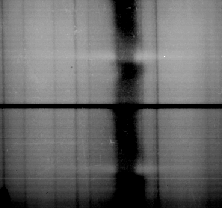
Recently we have continued these observations with the help of new
equipment. In Figure 3 the image frame with the moustache
acquired using a CCD - detector is presented. We can use the programs created
for processing digitized photographic images in order to process these data
as well.
The result of this work is a developed set of programs for spectral data processing. We can say with certainly, that on the base of our set of programs, processed photographic images become comparable to real CCD images. After this rather difficult processing is complete we can use the two sorts of data together as a common series as is required for the investigation of long period solar phenomena (in particular) and many other problems of solar physics.
We are grateful to Dr. N.M.Firstova, as main observer at LSVT, for her invaluable co-operation during observations.
Skomorovsky, V. I., & Firstova, N. M. 1996, Sol.Phys., 163, 209
McLean, I. S. 1989, Electronic and computer-aided astronomy: from eyes to electronic sensors, (Ellis Horwood Limited), 193
Next: A Parallel Procedure for the Analysis
of Long-term Sequences of Light Curves
Up: Applications
Previous: Determination of the Permissible Solutions Area by Image Reconstruction from a few Projections: Method 2-CLEAN DSA
Table of Contents -- Index -- PS reprint -- PDF reprint