Next: Chandra Data Archive Download and Usage Database
Up: Database Systems
Previous: Optimizing the Performance of ISO and XMM-Newton Data Archives
Table of Contents -
Subject Index -
Author Index -
Search -
PS reprint -
PDF reprint
Gasson, D., Bell, D., & Hartman, M. 2003, in ASP Conf. Ser., Vol. 295 Astronomical Data Analysis Software and Systems XII, eds. H. E. Payne, R. I. Jedrzejewski, & R. N.
Hook (San Francisco: ASP), 279
ANDES: NOAO's Observatory Database System
D. Gasson, D. Bell, M. Hartman
National Optical Astronomy Observatory,
950 N. Cherry Ave. Tucson, AZ
85719
Abstract:
ANDES (the Advanced NOAO Database Expert System) is NOAO's new observing
proposal system. Recent improvements include the phase out of legacy
components, such as our previous Access-based effort called ALPS++. New work
focuses on pre and post-TAC procedures such as importation, scheduling,
collection of observing reports on the mountain, and automatic compilation
of various statistics. The ultimate goal is to provide an environment which
allows a comprehensive understanding of the collection, evaluation,
scheduling, execution and post-execution of proposals and programs.
With the introduction of NOAO's new observing proposal system, ANDES
(the Advanced NOAO Database Expert System), it has become easier to
track a proposal from conception to execution-an approach that is often called
end-to-end (e2e) in the jargon of the business sector. We give a brief
description of some of the steps involved in this process at the NOAO, and
explain our approach.
Investigators can create a NOAO proposal in a number of ways, but they
all boil down to the construction of a LATEX file either through the use of
a web form, e-mail template, or submission of an XML file. This LATEX file
is then parsed via a Perl script into a more structured format that is
suitable for ingest into the database system (Bell, Barnes & Pilachowski 1998).
We require that every proposal be scrutinized by a person upon import to
ensure the integrity of the data. In particular, it is crucial that
investigator attributes such as name, e-mail, institution and address are
carefully looked at since we maintain a master list of such information.
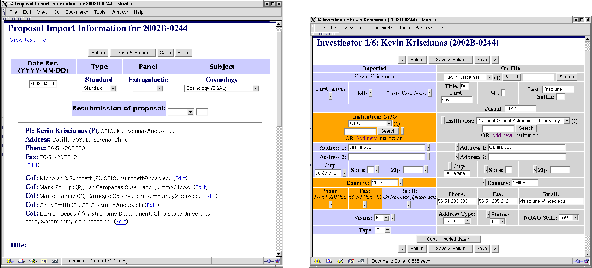
Figure 1 demonstrates part of the web interface that allows our importers
to do this. Highlighted cells represent a mismatch between the information we
already have on file about a certain investigator, and the information which
they have given us in the current proposal. It is up to the importer to decide
what, if any, changes need to be made in such a situation. Run information is
handled in an analogous manner.
Figure 1:
Left. From this page, most proposal
attributes are available for perusal by importers. In particular,
it is required that each investigator and run is looked at in order to
ensure mistakes and duplication are kept to a minimum.
Right. If an investigator is already in our database (because
they have proposed in previous semesters), that information is
displayed in the ``On File" column, and can be compared and updated to
reflect any changes. At least the name and e-mail address must be defined
before the page will allow editing of the next investigator.
 |
Twice a year the NOAO's time allocation committees meet and decide how to apportion
telescope resources for the coming semester. This process is discussed in more
detail in Bell, Gasson & Hartman (2002) and Gasson & Bell (2003).
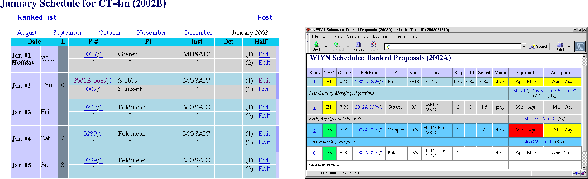
Once proposals have been submitted, imported, and eventually graded and
ranked by time allocation committees, NOAO schedulers can begin their
job. In order to facilitate this process, we provide a simple, but effective,
web interface (see Figure 2) for entry of scheduling information. We also
dynamically generate a list of ranked proposals that uses color coding to
draw attention to possible discrepancies. For instance, if a proposal has
been scheduled in time that is brighter than requested, or in a month
outside the optimal or acceptable date ranges specified on the proposal, the
corresponding cell is colored. It is, again, entirely up to the scheduler to
decide what, if anything, they will do to address these issues.
Figure 2:
Left. The schedule is edited on a month-by-month basis.
Contiguous blocks of runs are color coded, and instrument changes are
bolded. Clicking on a proposal number brings up more in-depth
proposal information, including any relevant scheduling constraints
or TAC comments.
Right. The schedule checker compares what observers asked for
to what they were actually scheduled. For instance, if a run has been
scheduled for a time when the moon is brighter than was requested, or
in a month outside the specified optimal or acceptable ranges, the
cell is colored.
 |
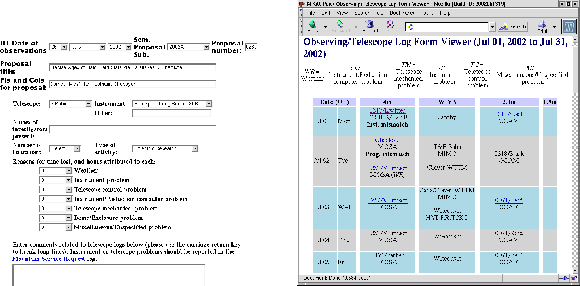
Tracking exactly what happens at the telescope at observing time is an
essential part of the night-to-night operation of the observatory. In
conjunction with many other pieces of software on the mountain, authorized
staff members can get an idea of the behaviour of the telescope from the
point of view of the observer via the electronic observing/telescope log form
(Figure 3).
At the end of each night, the observer fills out this form (identified by
their proposal number), and specifies how much time has been lost to such
things as weather and other technical problems. Support staff may then visit
the log form viewer, fix mistakes (many of which are automatically flagged
by the software), and view summary statistics over an arbitrary length of time.
Figure 3:
Left. This page uses the current date
and time to guess which program is likely to have taken place, and
displays any relevant information (i.e., proposal number, investigators,
title). This information can be overruled if it is found to be wrong
due to changing conditions.
Right. Observing statistics can be viewed by staff and used to
form a picture of the behaviour of the telescope over a period of time.
In addition, if there are any discrepancies between the content of the
log, and what is expected (a different instrument was used than was
recorded on the schedule, for instance), a note is displayed.
 |
One difficulty associated with our move away from ALPS++ and Microsoft Access
to ANDES has been creating paper reports. Many reports can be effectively
moved to the web, and made more useful in the process (this is particularly
true for some kinds of statistics which change often) but there are some
for which it is either preferable or required to present them on paper. We
employ a couple of strategies in this situation.
The first, and simplest, is to write a script which produces a comma-delimited
file. This works well for data that is essentially tabular in nature, and
likely to be further processed by support staff. An example would be many of
the quarterly or annual reports the NSF requests.
The second solution, used in situations where more formatting is needed,
is to programmatically fill in LATEX templates. This requires a good deal more
effort up front, but has proven to be quite effective. We often use this
approach to create professional looking reports in near real time during the
TAC process.
References
Bell, D. J., Barnes, J. & Pilachowski, C. 1998,
in ASP Conf. Ser., Vol. 145, Astronomical Data Analysis
Software and Systems VII, ed. R. Albrecht, R. N. Hook, &
H. A. Bushouse
(San Francisco: ASP), 288
Gasson, D. & Bell, D. 2003, in ASP Conf. Ser., Vol. 281, Astronomical Data Analysis Software and Systems
XI, ed. David A.
Bohlender, Daniel Durand and T. H. Handley (San Francisco: ASP), 457
Bell, D., Gasson, D., & Hartman, M. 2002, SPIE 2002, in press
© Copyright 2003 Astronomical Society of the Pacific, 390 Ashton Avenue, San Francisco, California 94112, USA
Next: Chandra Data Archive Download and Usage Database
Up: Database Systems
Previous: Optimizing the Performance of ISO and XMM-Newton Data Archives
Table of Contents -
Subject Index -
Author Index -
Search -
PS reprint -
PDF reprint