 |
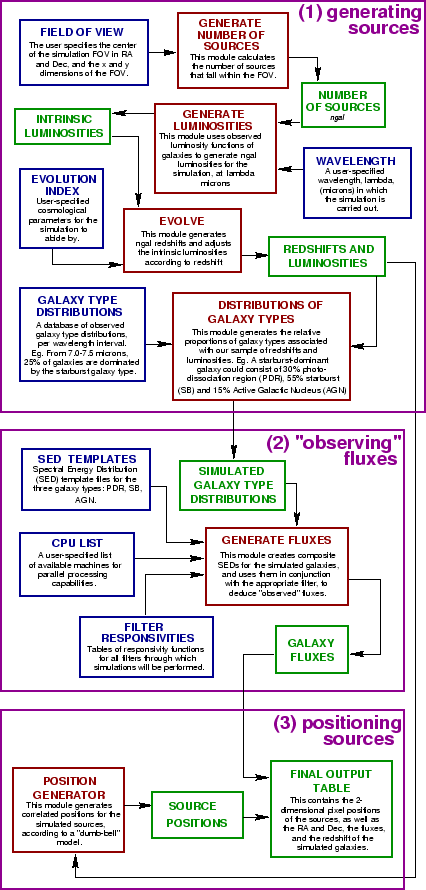
The extragalactic simulator has a modular, linear design and consists of six stand-alone C modules. These modules are represented in Figure 1 as (red) boxes labeled: in (1), ``GENERATE...'', ``EVOLVE'', and ``DISTRIBUTION...'', in (2), ``GENERATE FLUXES'', and in (3), ``POSITION...'' . There are several additional input tables of data and parameters which are bound to the modules via a single C-shell script. The design of the simulator is well-suited to future extensions. Each module can be run separately at the command line for testing and debugging purposes and also produces its own output and log files. All user-specified parameters reside in a separate file that can easily be up-to-dated with new inputs (e.g., SED templates, filter responses, etc.).
|
The simulator has been streamlined for high-speed processing and is capable of generating tens of thousands of extragalactic sources in minutes. This is enabled by splitting the most time consuming process over several processors (currently up to 20) and running them in parallel. Users can simply list available machines and run processes in the background of each machine.
In the first stage of the simulator, a set of extragalactic sources is generated for a given set of input parameters. The simulated sources fall within a user-specified area on the sky and have three basic attributes--see part (1) of Figure 1:
In the second stage of the simulator, available Spectral Energy
Distribution (SED) templates for PDR, SB, and AGN galaxy types are used--see part (2) of
Figure 1--to
construct individual composite SEDs based upon the proportions of
types calculated in the previous stage. With the filter response function of the specified
SIRTF wavelength, the ``integrated luminosities'' of the
galaxies are calculated by multiplying by the normalized SEDs and integrating
to determine flux densities from the following relation:
![]() where
where ![]() is the integrated
luminosity, and
is the integrated
luminosity, and ![]() is the luminosity-distance of the galaxy.
is the luminosity-distance of the galaxy.
In the last stage of the extragalactic simulator, galaxies are placed on the 2-dimensional sky--see part (3) of Figure 1--with correlated positions calculated according to a dumb-bell model of fractal structure (Soneira & Peebles 1978). The final output of the simulator contains luminosities, redshifts, fluxes, and positions in Right Ascension and Declination of the simulated galaxies.
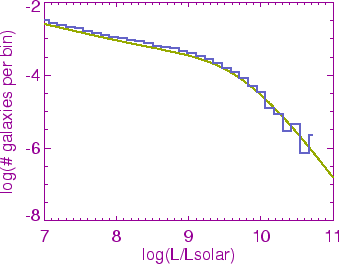
The extragalactic simulator has been tested for four filters on the
SIRTF IRAC instrument: 3.6![]() , 4.5
, 4.5![]() , 5.8
, 5.8![]() , and
8.0
, and
8.0![]() . The table look-up method used to generate the
luminosities of the simulated galaxies works well at all four
wavelengths (see Figure 2).
. The table look-up method used to generate the
luminosities of the simulated galaxies works well at all four
wavelengths (see Figure 2).
 |
The extragalactic simulator is capable of generating large numbers of galaxies within a given patch of sky for SIRTF pipeline testing. Tens of thousands of galaxies can be simulated within minutes and further techniques to speed up the process are under consideration. This includes ``table look-up'' methods in the flux calculation module that could replace calculation of individual fluxes. When available, luminosity functions can be replaced by newer ones recorded at wavelengths close to SIRTF instrument wavelengths. SED templates can also be replaced by newer, more accurate ones when available. In order to simulate an observation of the real sky, this simulator will soon work in conjunction with the SKY model galactic simulator (Cohen 1993) to produce data sets that contain external galaxies as well as objects within our own.
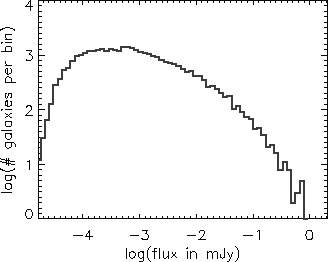
A common test of cosmological models is a ![]() -
- ![]() plot of
galaxies. An effective
test requires a complete sample of galaxies out to relatively high
redshifts, and Figure 3 shows a plot of
plot of
galaxies. An effective
test requires a complete sample of galaxies out to relatively high
redshifts, and Figure 3 shows a plot of ![]() versus
versus
![]() for 34,557 simulated extra-galactic sources with redshifts in the
range
for 34,557 simulated extra-galactic sources with redshifts in the
range ![]() =0 to 5, ``observed'' using the IRAC
=0 to 5, ``observed'' using the IRAC ![]() filter. The extragalactic simulator produces galaxies with fluxes that
are at the limit of IRAC sensitivity (
filter. The extragalactic simulator produces galaxies with fluxes that
are at the limit of IRAC sensitivity (
![]() ).
).
Cohen, M. 1993, AJ, 105, 1860
Soneira, R. M. & Peebles, P. J. E. 1978, AJ, 83, 845